


I've done the final analysis with a set of 3466 sequences, each 39bp) and each containing at least a rough match to
 the USS motif. These were obtained by motif searches told that 3000 sites were expect on each strand; 1650 and 1816 were found. 1454 of these contain perfect matches to the 9bp core consensus, 512 have one-off matches, 557 have two-off matches, and 943 have core sequences that match the consensus at no more than 6 places. I think having this many mismatched sequences gives the analysis the power to detect correlations even between the highly-conserved core positions.
First, look at the control figure to the left. This shows analysis of 3500 random sequences, each 39bp long, taken from random segments of both strands of the H. influenzae genome. The bar charts at the top and left can be ignored - they show the 'information' at each position, but the scale for these bars only goes from 0.0 to 0.00 (weird, I know. I guess '0.0' represents zero, and '0.00' represents less than 0.01),
It's a bit surprising (to me) that the few scores higher than 0.002 are mostly found between positions separated by 3 (positions 1 and 4, positions 3 and 6, positions 4 and 7, positions 9 and 12, etc.). I suspect this has something to do with the way coding for proteins constrains the genome, but it's not something I'm going to follow up.
Here's the 'experimental' image. It shows significant correlations only between close-neighbour positions, and only between neighbours within each of the two flanking conserved AT segments. I suspect that even these 'significant' correlations are quite weak (the highest correlation score is only 0.107), but I don't understand the analysis well enough to be sure. The documentation is very brief; I may need to send someone an email asking for clarification.
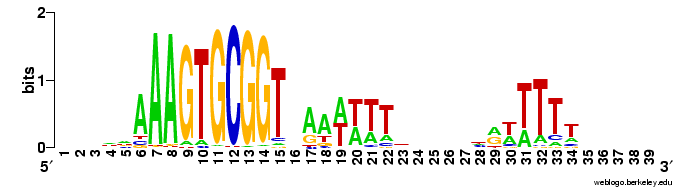
(Here's a logo as a reminder of the motif.)
The CBS tools website is great, but most of their services have limits - not good for people who want to play with whole genomes. Most websites limit input in this way for good reasons - you can't have users submitting all of GenBank to your site!
ReplyDeleteThe MatrixPlot paper says that it's available on request, so they'll license it to you if you email them (should be a contact on the website somewhere). I've obtained SignalP and TMHMM from them before, they're pretty helpful and the standalone software is worth having if you're using it a lot.
Having enough power depends on how much variation is present at each site. Although having that many sequences increases the probability of having variation at each site, it still doesn't tell you that you have enough power at all sites. I don't think it matters anyway. In the 9 bp core, all of the sites are "correlated" with one another and we know this anyway.
ReplyDelete